Blog Post for October 3, 2014

Today we began working in class on our second project.  I choose to interrogate the interface visme.co a presentation platform.

What I Did Today

I had already started creating an infographic, but switched to a presentation because it will be easier to present.  I outlined my presentation and created the basic slides and headings.  Working with visme.co to create the presentation gave be a better understanding of the platforms affordances and constraints.

Why I Did It

I decided to start working on my presentation, so that I would have it done in time to present.  As I explained above, I additionally decided to use the platform I am interrogating for my presentation to help me understand the website more.

Interrogating an Interface: Friday Edition

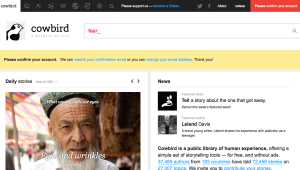
Today I really started exploring my tool for the Interrogating an Interface project. I went through all the tabs in the menu and set up my own account to explore what users go through in signing up. I also started filling out my Writer/Designer Analysis questions although it is taking me a little bit of time to get through them as I want to be as thorough as possible with my notes. I’m really enjoying exploring this tool, it has been simple and fun to look through all the different stories people all over the world are sharing. I still need to finish my Writer/Designer Analysis questions and take more screenshots to develop my powerpoint and page for the blog, but it’s coming along! And I am actually looking forward to further interrogation of this beautiful tool.

cowbird main page


A timeline of Dipity

What I did: Today I researched more about my tool, Dipity. I also made my own account. By working through the google spreadsheet questions today, I was able to narrow down some facts.

https://docs.google.com/a/vt.edu/document/d/1tJ6SOBuV-tRP2tAK50uyNC4OCv-Aan9M4j8S18cq8n4/edit?usp=sharing

Why I did it: I think it’s important to have my own account on Dipity so that I can follow certain timelines and play with it to create my own. I learned a lot more of the basics of the site today by doing so, as well as by writing down everything I noticed within the google doc. The organization really helps me separate certain qualities from others. Next class I hope to create some useful screenshots as well as write some of my actual essay by piecing together the facts.


10.03.14

What I Did

Unfortunately over the past week, I’ve been pretty sick and therefore have had limited time to work on school work. My project two is just really getting off the ground now, so today I focused on getting to know Pixlr, my interface, and starting to answer the writing designer analysis questions.

Why I Did It

I’m using the writer designer analysis questions to help analyze my blog because they really give a good overview of everything I should be talking about during my presentation. If I answer these questions, I have an excellent starting place for my presentation and my paper.


Friday, October 3rd

What I did

Today I simply began working on the Writer Designer Analysis Questions. I did not finish.

Why I did it

In order to really make a thorough analysis of the interface, I need to understand every aspect of it; I think the questions will be very helpful with that.


The One With the Google Doc

What I did…

Today I mainly focused on filling out the Google Doc that outlines the various parts of the interface. I also twirled around in my chair for a bit but I figured you didn’t want to know that, but I decided to tell you anyway because this was only going to be a sentence if I didn’t. Oh look I just rambled for two lines I deem that a success in making this paragraph longer.

Why I did this…

I mainly did this because I wanted to get a jump start on my project but I didn’t feel like writing the paper yet. I wanted to collect my thoughts and feelings about my interface before I begin to write my actual content. This helped me figure out where I want to begin so I can start working on the paper this weekend.


Pixton Fun

I picked Pixton to work with and so far I have done my best to explore the site. Pixton is a comic strip creator and is a lot of fun. It is also incredibly full of features and tools making the process of getting to know it a bit time consuming. Right from signing up […]

Starting Project 2

What I Did 

Today was the first day I began working on my Project 2 assignment. The resource I am focusing on is called Piktochart, which is a site that allows you to make interesting infographics, reports and presentations. They offer a variety of designs, graphics, and even charts. So far, I really like the website. During class, I just approached the site like someone needing to make a presentation for a project, completely open and unbiased. I made sure to note which features I really liked and which were hard to navigate or that the site lacked. I’m still learning how to use Piktochart, but I believe it should be relatively easy to master.

I still need to site down and write out all my thoughts for the essay portion of the project. I plan on using the actual site itself to make the presentation.

Why I Did It 

I spent the whole class period learning how to use the site because I want to understand the ins and outs of Piktochart before I present and report on it. This will also help for when I present and my peers may have questions to ask me.


Day One of Project Two

What I Did

Today, I signed up for my own Draft account and began experimenting with the site from an actual user’s point of view. I also began filling out the Writer/Designer Analysis Questions. Simply, I began researching my tool and thinking of interesting ways to present its affordances and constraints to the class.

Why I Did It

I signed up for my own Draft account because I want my presentation and web essay to provide a full analysis of the affordances and constraints of the site. I began filling out the Writer/Designer Analysis Questions because the answers will provide valuable research that will make writing my web essay much easier.